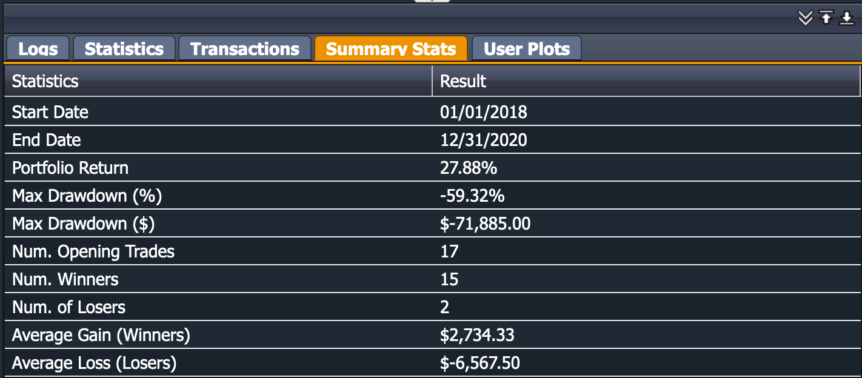
The Backtest Results displays the Summary Statistics of your strategy.
- Start Date: Start date of your backtest
- End Date: End date of your backtest
- Portfolio Return: Percentage return of portfolio
- Max Drawdown: max loss from a peak to trough of the portfolio, before a new peak is attained
- # Opening Trades: the number of opening transactions, excluding closing transactions (i.e. expiration)
- # Winners / Losers: number of trades with profits (winners) or losses (losers). Both realized and unrealized gains/losses are used to calculate profits/losses
- Average Gain / Loss: average gains of the winning trades and average losses of the losing trades
If your backtest results change from one backtest run to another, please review our Technical FAQ (Analyzing Results) on why this happens and how to update your strategy accordingly.
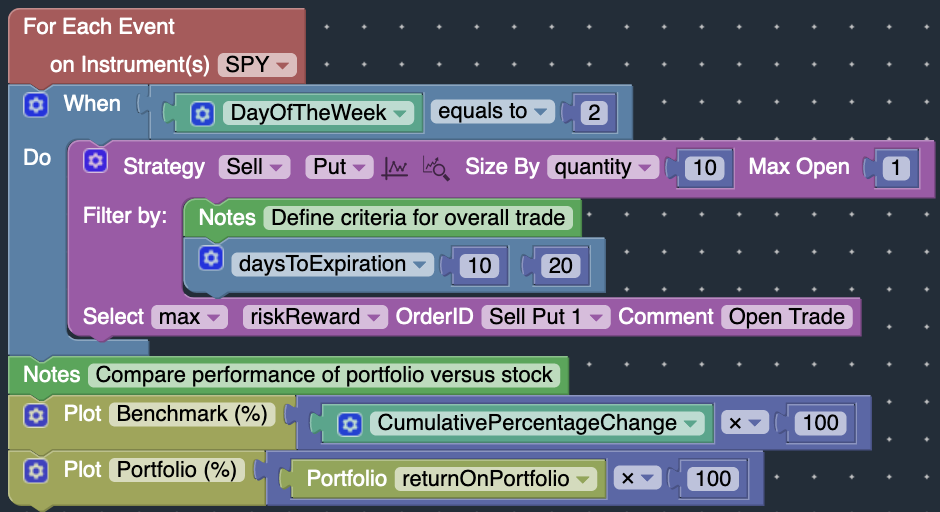
To demonstrate how each of these statistics are computed, here is an example strategy which we will use to analyze the backtest results:
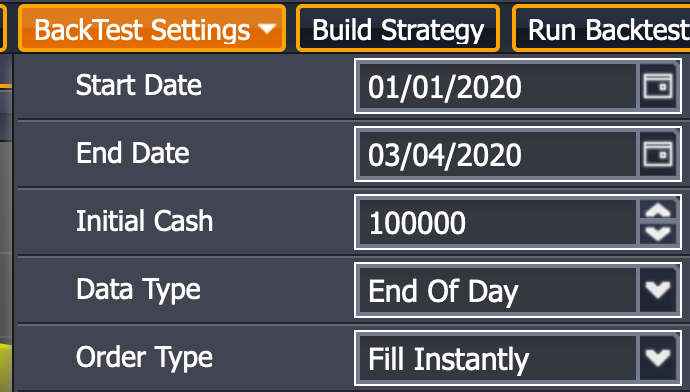
We will use the following Backtest Settings:
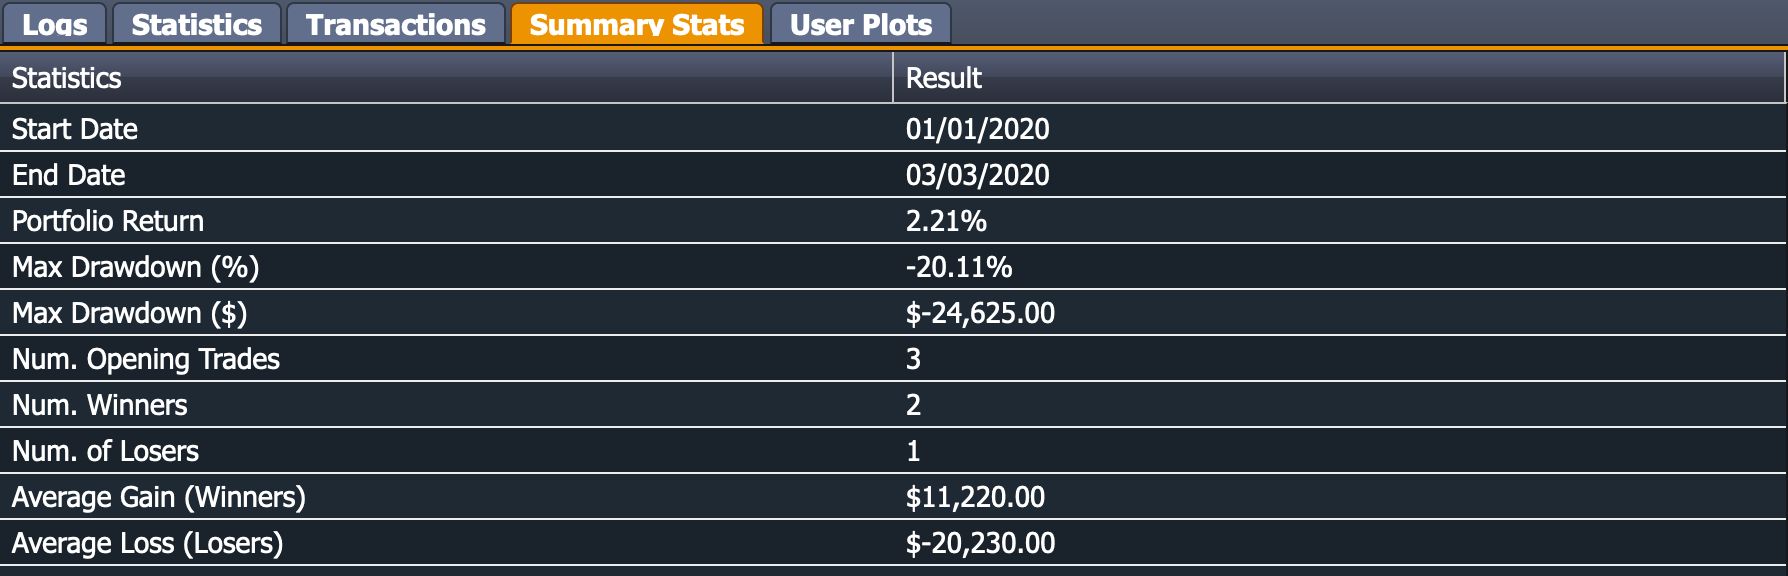
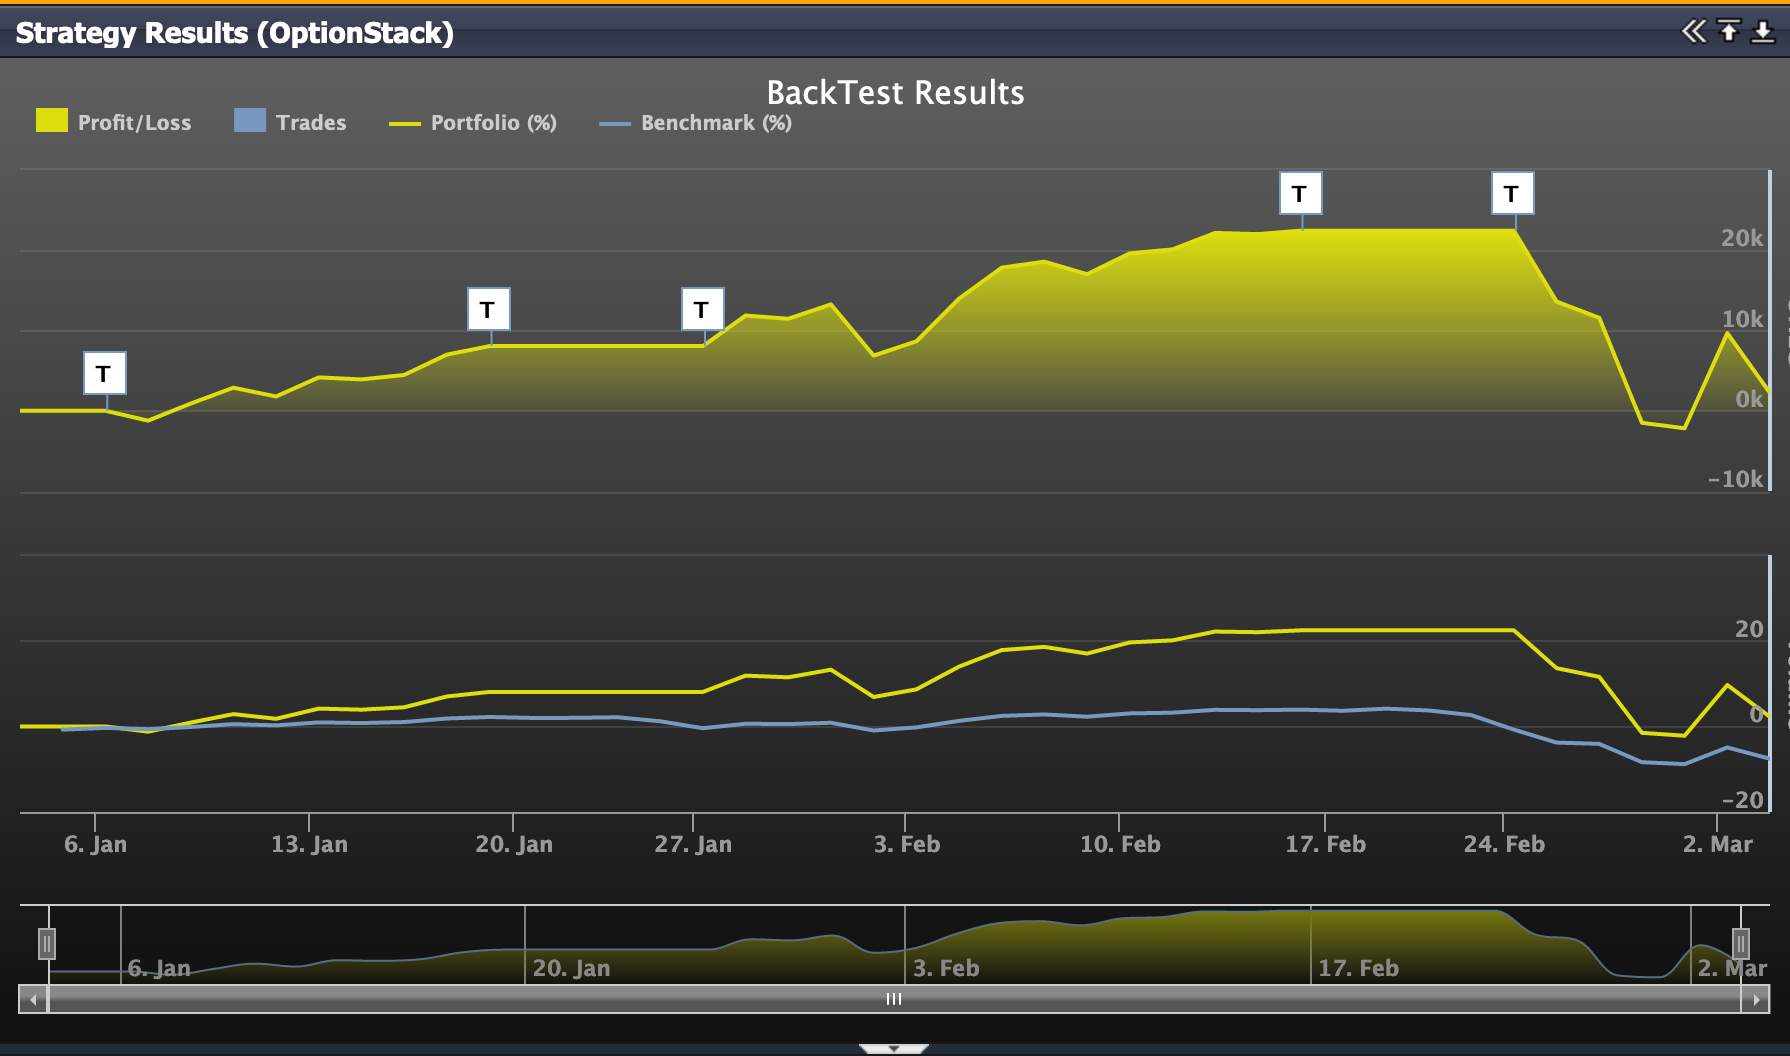
The results of the backtest are as follows: (Download Summary CSV)
Transactions Log: (Download Transaction CSV)
![]()
Daily Profit/Loss: (Download Profit/Loss CSV)
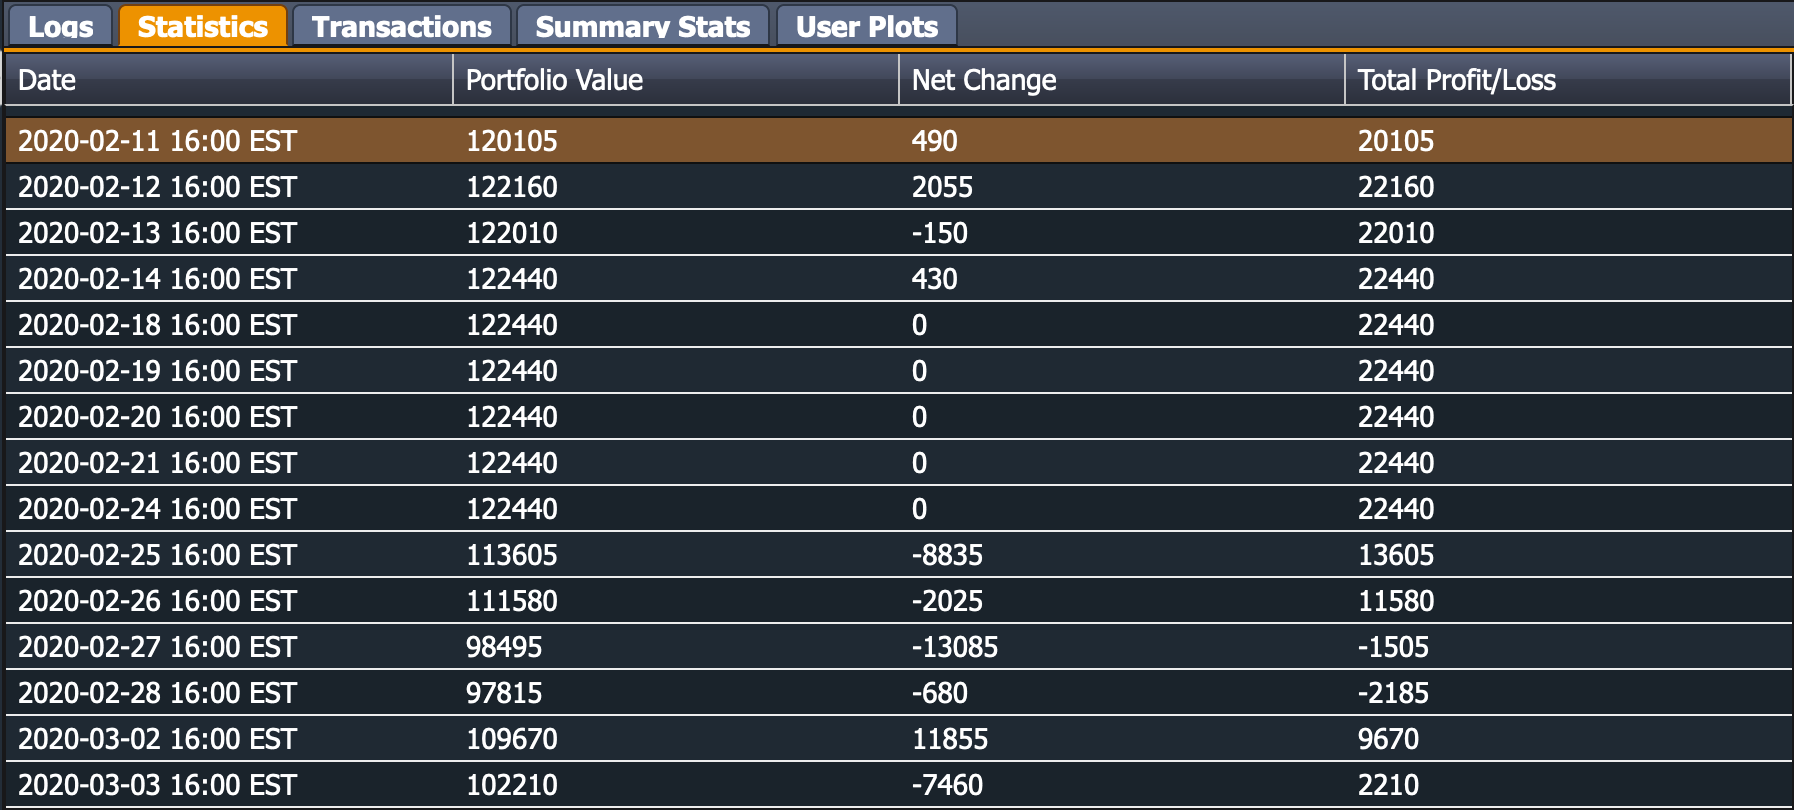
To compute the summary statistics manually, we will use the daily profit/loss as well as the transaction logs to verify that is matches the summary statistics.
- Ending portfolio value is $102,210
- Starting portfolio value is $100,000.
- Return on portfolio: (102,210-100,000)/100,000 = 2.21%
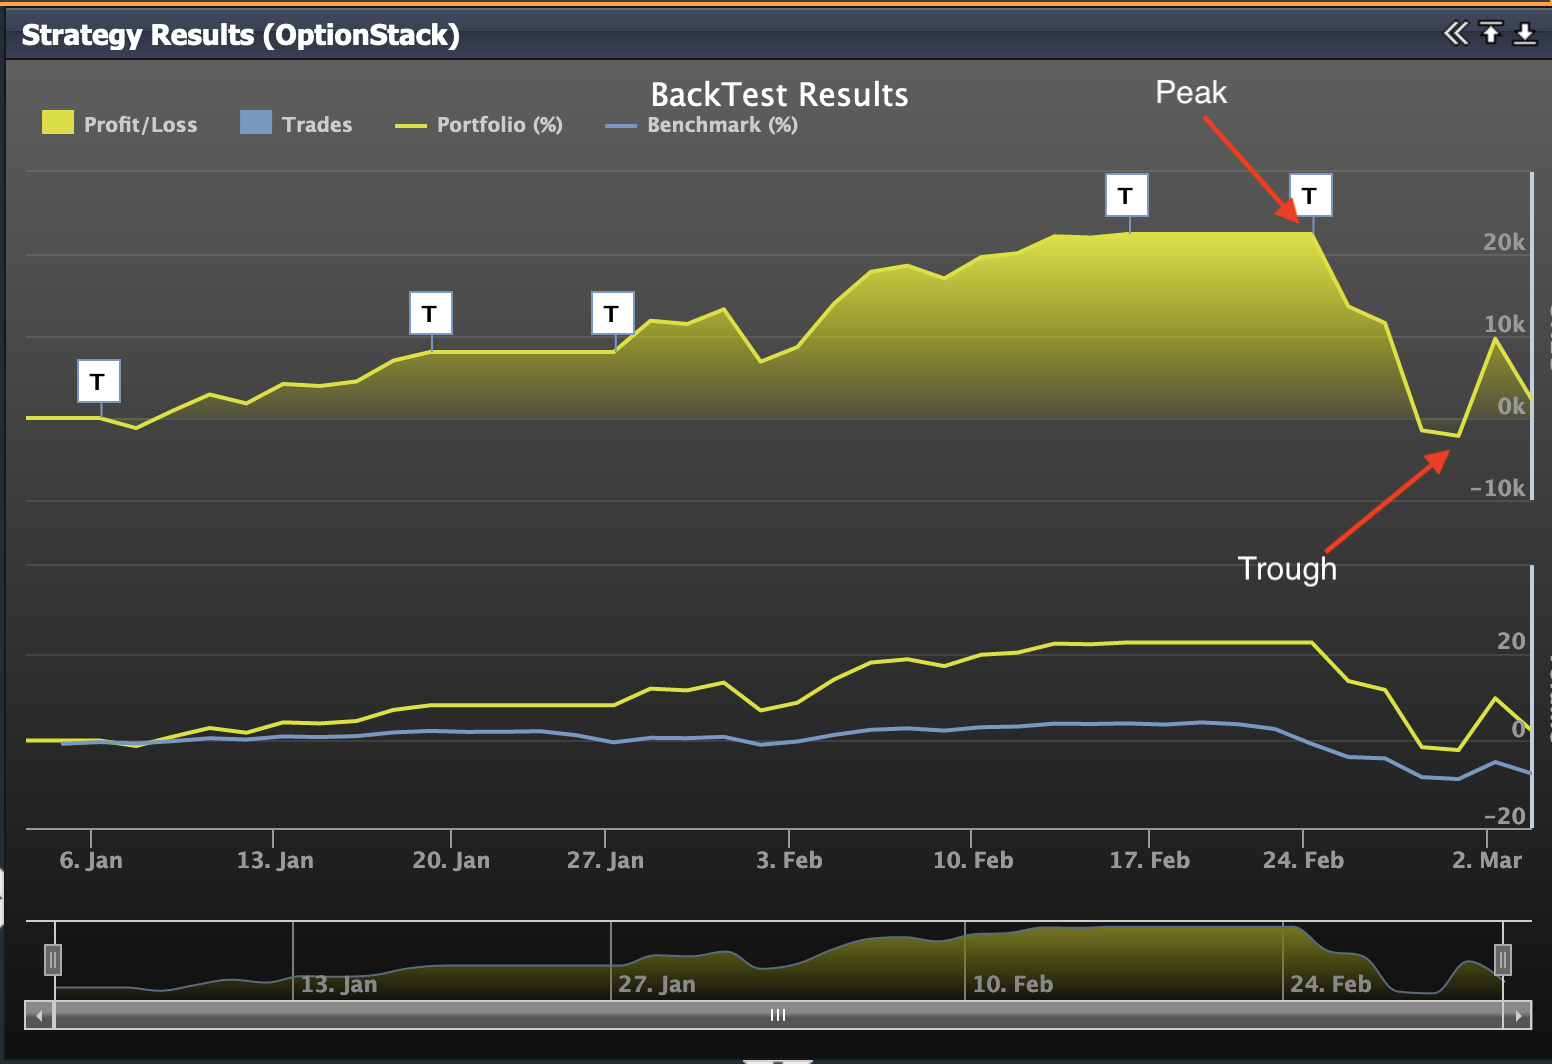
- Peak of portfolio: $122,440 (on Feb 24, 2020)
- Trough of portfolio: $97,815 (on Feb 28, 2020)
- Max DrawDown (%) = (Trough – Peak) / Peak = (97,815-122,440)/122,440 = (-20.11%)
- Max Drawdown ($) = (97,815 – 122,440) = (-24,625)
Number of Opening Trades:
- While there are a total of 5 transactions from the transaction logs, there are only 3 opening trades. 2 trades are closing / expiration trades.
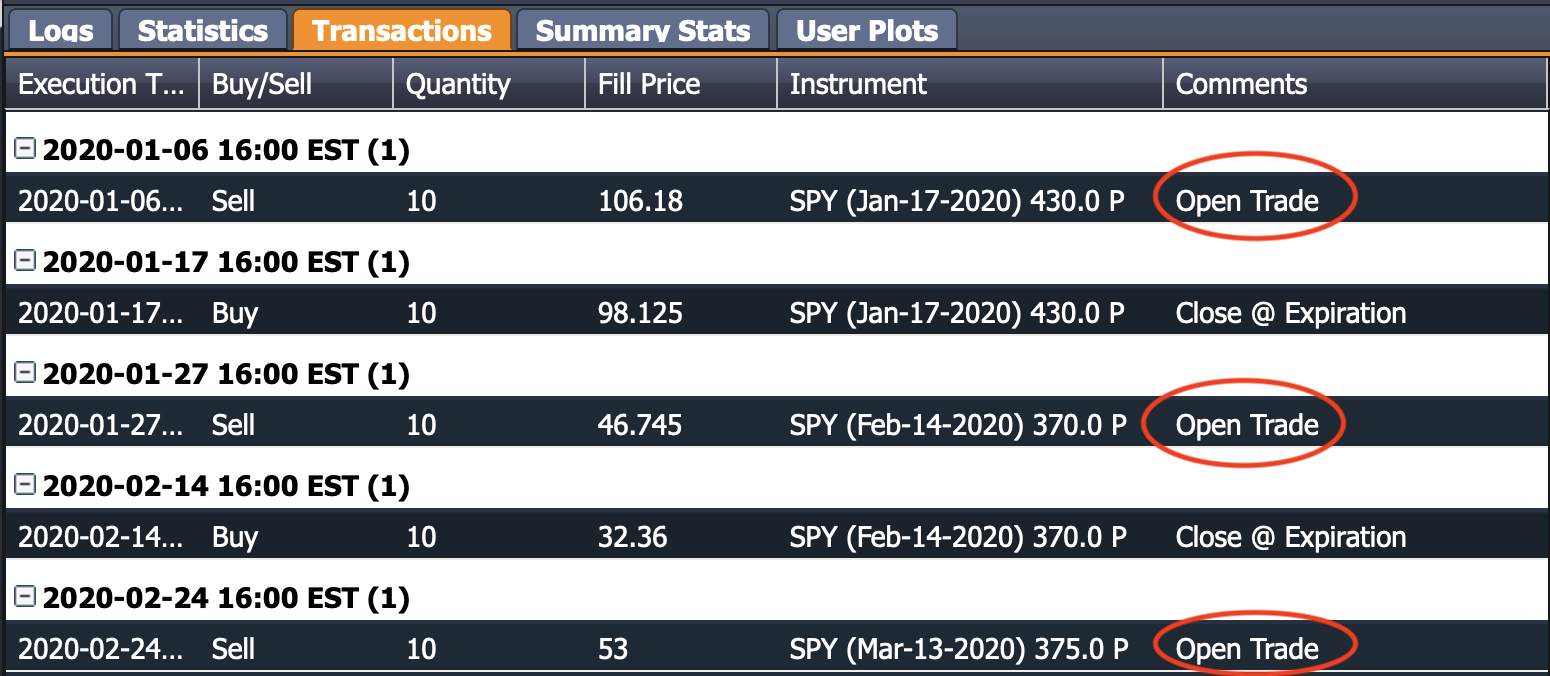
Profit / Loss of Each Opening Trade:
-
- 1st Opening Trade: Sell to Open for $106.18, and Buy To Close for $98.125.
- Realized Gain: (106.18 – 98.125) * 10 contracts * 100 = +$8,055
- 2nd Opening Trade: Sell To Open for $46.745 and Buy To Close for $32.36
- Realized Gain: (46.745 – 32.36) * 10 contracts * 100 = +$14,385
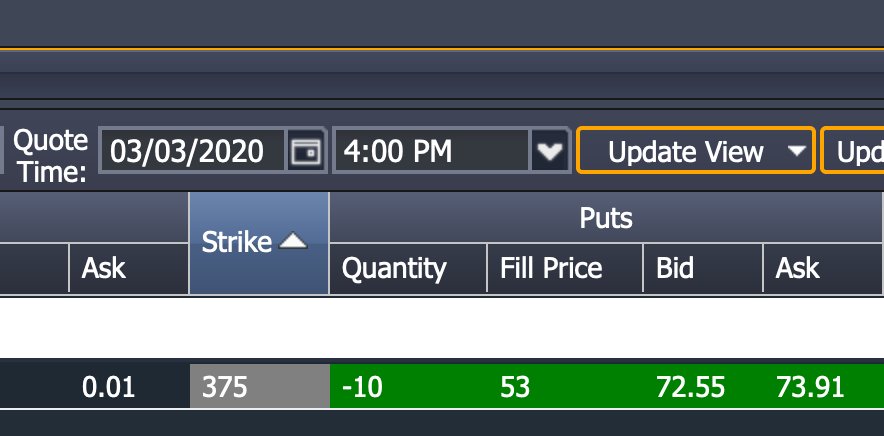
- 3rd Opening Trade: Sell To Open for $53 but remains open at end of backtest. Will need to compute the unrealized gain / loss of this trade using prices at the end of the backtest date (3/3/2020)
- Price of open option at end of backtest using mid prices from the Option Chain: (72.55 + 73.91) / 2 = $73.23

- Unrealized gain/loss: (53-73.23) * 10 * 100 = (-$20,230)
- 1st Opening Trade: Sell to Open for $106.18, and Buy To Close for $98.125.
Number of Winners:
- 2 winners: Trade 1 and Trade 2
Number of Losers:
- 1 Loser: Trade 3 had unrealized losses at end of backtest
Average Gain of Winners:
- Trade 1: $8,055
- Trade 2: $14,385
- Average: (14,385 + 8,055) / 2 = $11,220
Average Loss of Losers:
- Trade 3: ($-20,230)
- Average: (-20,230) / 1 = (-20,230)