There are several measures of volatility. (Historical Volatility, Implied Volatility, Average True Range, Bollinger Bands, etc..)
The first is the actual volatility of the stock. This is seen in the HistoricalVolatility, which can be measured over any time frame but usually gauged in 10-, 20-, or 30-day readings.
![]()
Implied volatility is the volatility expectation that is priced into individual options. The implied volatility of an option is actually backed out of the price of the option. All the inputs of an options pricing model are known (time to expiration, strike, price, interest rates) except for the volatility that the option is pricing in.
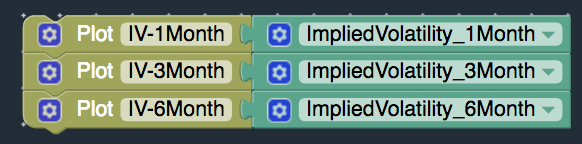
Theoretically, the implied volatility for all options of a given underlying should be the same, but that is NOT the case. So implied volatility averages can be used for given months or given time frames. This allows one to get a single number for implied volatility that can be charted.
There are a couple of different ways to calculate the implied volatility for a stock that factors in the different volatilities of the options (volatility surface) of the underlying.
One method is the Whaley model, which was used to calculate the original VIX index based on the OEX prices.
The second method is the Variance Swap method, which is used to calculate the current VIX index based on SPX prices.
Other volatility indicators include Average True Range (ATR) and Bollinger Bands. Some people try to use these as alternative “VIX” measures for individual equities.

Sign up today to see how leveraging volatility can give you an edge in your trading!