Plot / Log Block
Plot / Log Block
The Plot blocks allows you to plot the value of a study directly to the chart. You can plot the various studies in the Market Studies Block and the Portfolio Studies block.
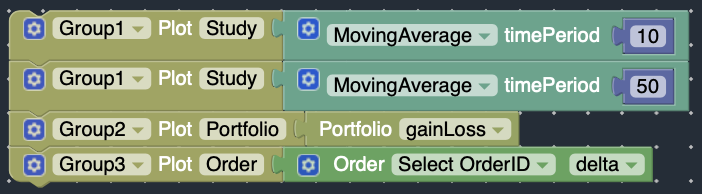
You can assign each plot to a different Plot Group by clicking on the “Gears” icon. Plots assigned into the same Plot Group will be plotted in the same section of the chart and will have the same chart scale and axis. You should group plots based on similar chart scale and comparability.
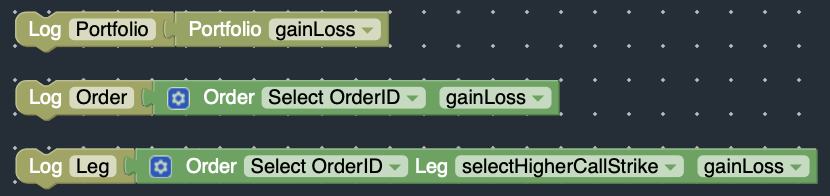
The Log Block is useful for printing out the value of your studies to the Logs Panel for debugging purposes.