Backtesting Best Practices
Backtesting is one of the most important aspects of developing a trading system. It can help you improve and optimize your trading strategies without risking any money.
However, if a backtest is improperly designed and implemented, it can lead to results that look “great on paper”, but may perform poorly in real world trading.
To ensure your backtests results are reliable, avoid these 3 common pitfalls:
Over-optimization
Backtesting can be exciting in that an unprofitable system can often be magically transformed into a money making machine with just a few tweaks. Unfortunately, optimizing a trading strategy to achieve highest profitability often leads to a system that will perform poorly in real world trading. Over-optimization can often lead to unreliable trading systems that may only work for a particular time period and data set.
Solution: Use out-of-sample data sets
To avoid over-optimization, it is important to reserve a time period of historical data for testing purposes.
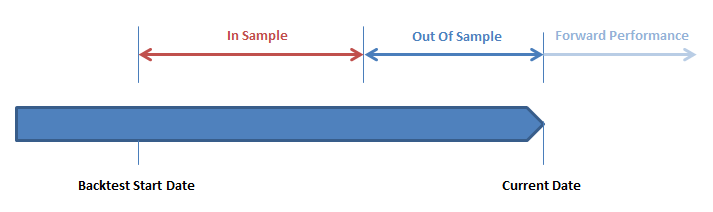
The initial historical data on which the trading system is tested and optimized is referred to as the in-sample data set. The data set that has been reserved is known as the out-of-sample data set.
By reserving a portion of the data set, it provides a way to test your strategies on data that has NOT been part of the optimization process. Hence, you will be able to determine how well your strategy might perform on new data (i.e. real world markets).
Prior to starting your backtesting, you can set aside a percentage of your historical time period to be reserved for out sample testing. One method is to divide the backtest data range into thirds, and use two-thirds for in sample testing, and one-third for out of sample testing.
You should have a long enough backtest range (at least 8+ years) in order to be able to divide your data between in-sample data and out-of-sample data.
Once a trading system has been developed and optimized using in-sample data, it is ready to be applied to the out-of-sample data. You can evaluate and compare the performance results between the in-sample and out-of-sample data.
If there is little correlation between the in-sample and out-of-sample testing, it is likely that the system has been over-optimized and will not perform well in live trading. However, if there is strong correlation in the performance between the in-sample and out-of-sample testing, it is more likely to perform well in real world trading.
Inappropriate Time Periods
The backtesting time period should include multiple market cycles, from bull markets to bear markets as well as non-trending markets. Testing on a time period when the market was in a different environment will cause inconsistent and misleading results.
Solution: Make sure there is enough historical data to contain a representative set of different market environments. (bearish, bullish, neutral markets)
In addition, your historical backtest range should go back to 2007 – 2008 to include the 2008 market downturn.
Execution Risks
A major risk in backtesting is assuming at what price to fill your trades. If you are trading instruments with wide bid-ask spreads, your trades may not be executed / filled at mid-prices.
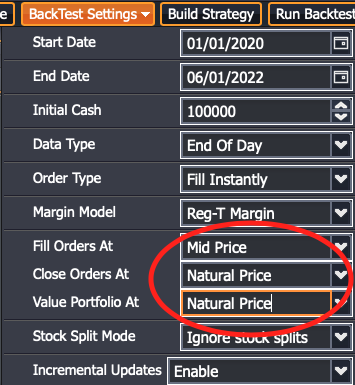
Solution: Avoid trading instruments with wide bid/ask spreads. Include slippage in your testing by executing your trades at natural price instead of mid-price.
You can adjust the slippage modes in the Backtest Settings.
Summary
A properly implemented backtest is one of the most important aspects of developing a profitable trading strategy.
- Avoid over-optimization by splitting your time periods into in-sample and out-of-sample time periods. Compare the performance of your strategy on the in-sample versus out-of-sample time periods.
- Select a long enough historical time range (18+ years) that includes multiple market cycles (bullish, bearish, neutral). The longer the historical time range, the better. Your historical backtest range should go back to 2007 – 2008 to include the 2008 market downturn.
- Stress test your strategy to account for slippage. Check how your strategy performs when executing trades at natural price versus mid price.
Upgrade to one of our premium plans to gain access to up to 18+ years of historical data, advanced slippage settings, and more powerful features.